Cereal
Saturday morning cartoons and a bowl of cereal was truly a time. I still enjoy cereal (and cartoons!), but today there are so many new cereals claiming to be “healthy” that it’s hard to know what’s what. I personally, AS A HUMAN (not fake AI reviewed), eat all these cereals and weigh their taste and (macro-based) health combined. Health is focused on the real macros: higher protein, higher fiber, lower sugar, and lower saturated fat. That’s not common in a cereal, but there are some diamonds out there. Feel free to send me more reqs for healthy cereals to try!
there’s
less! Sugar, hopefully
The Tiers
The top 9 out of 53, by Tier: taste and health combined. Go by the letter. Any box in Tier A is a good pick; the small score out of ten only sets the order inside a Tier. Protein, fiber and sugar taken off the actual side panel — not off the front — and shown as a share of a day’s worth in 100 grams.
Green is good for a cereal, orange is middling, red is poor, and dark red means half a day’s sugar or more. Sugar is total sugar, counted against 50 grams. ~ means the label prints no protein %DV, so it is estimated from grams.
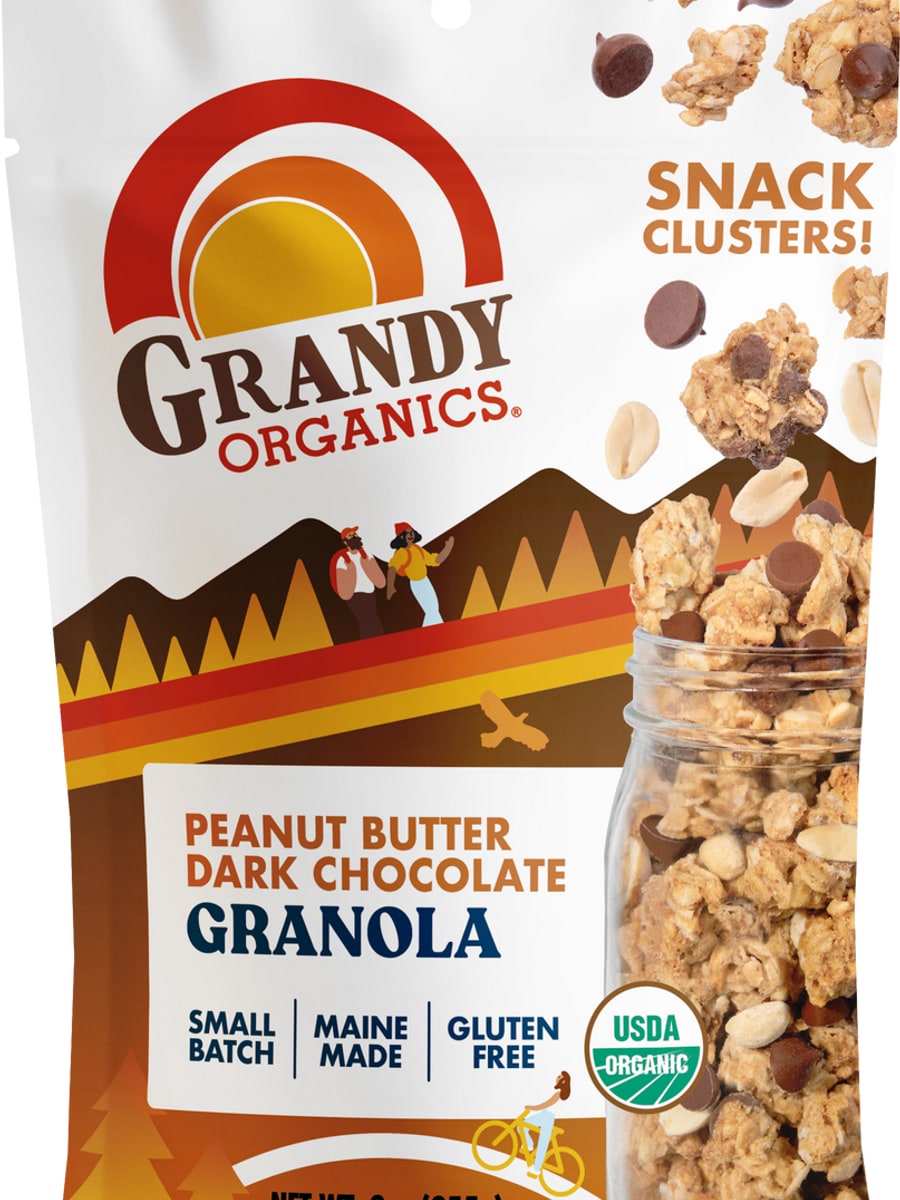 Grandy Organics Peanut Butter Dark Chocolate Granola “Tastes more like a snack than a granola, tasty dark chocolate” — and it still won. ~13% Protein (Poor) 38% Fiber (Good) 36% Sugar (Poor)
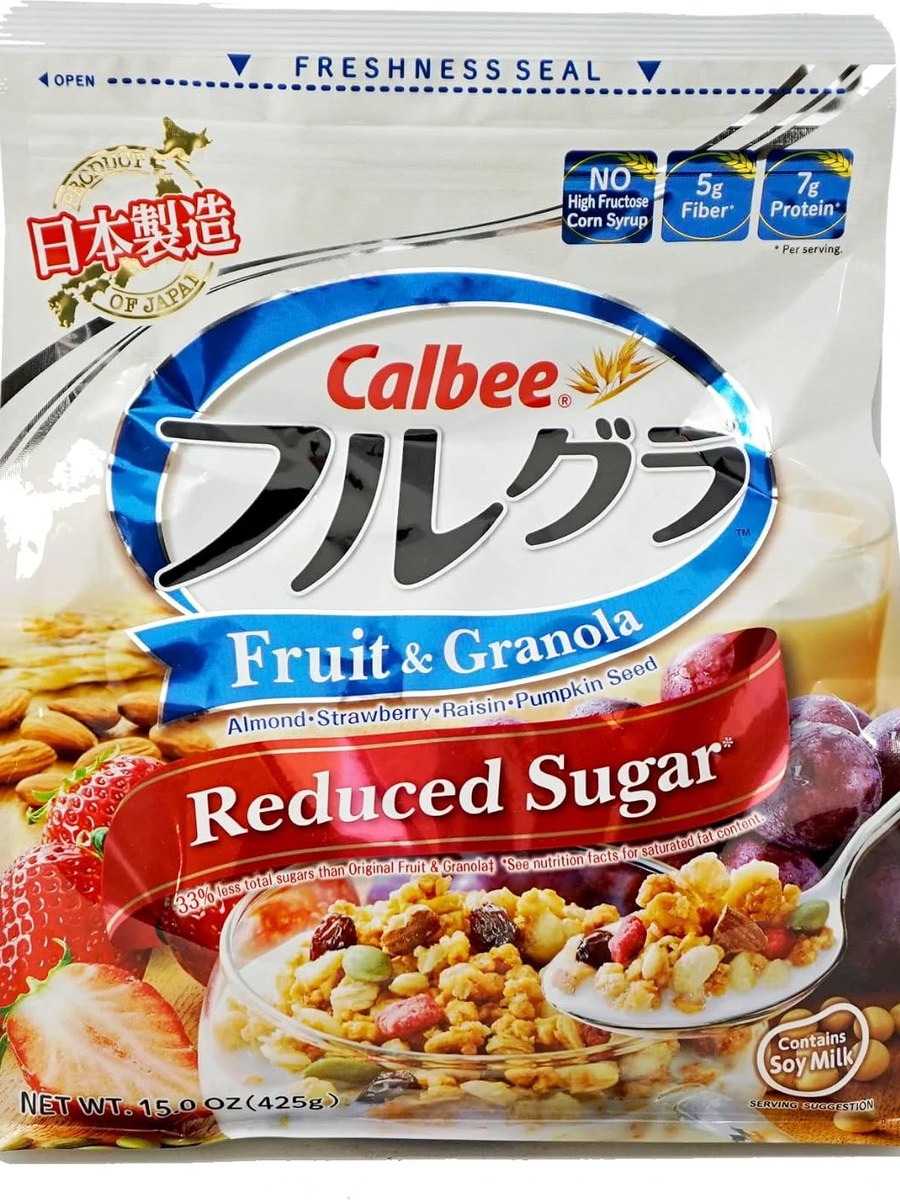 Calbee Frugra Fruit & Granola, Reduced Sugar 25% Protein (Middling) 38% Fiber (Good) 14% Sugar (Good) 3 Tier S 6.1 / 10
 IKEA Hjälteroll Granola with Nuts and Dried Berries ~16% Protein (Poor) 53% Fiber (Good) 15% Sugar (Good)
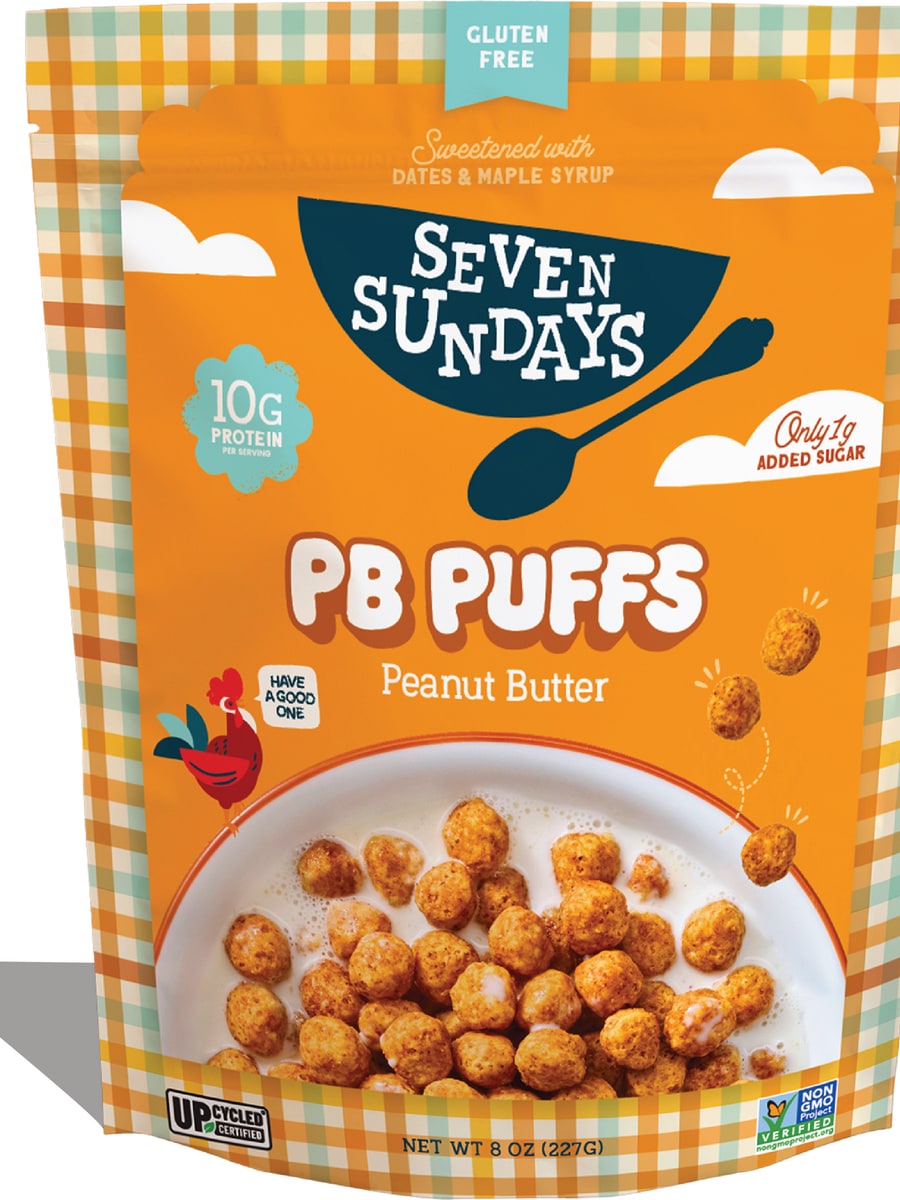 Seven Sundays PB Puffs, Peanut Butter 33% Protein (Good) 9% Fiber (Poor) 30% Sugar (Poor) 5 Tier A 5.9 / 10
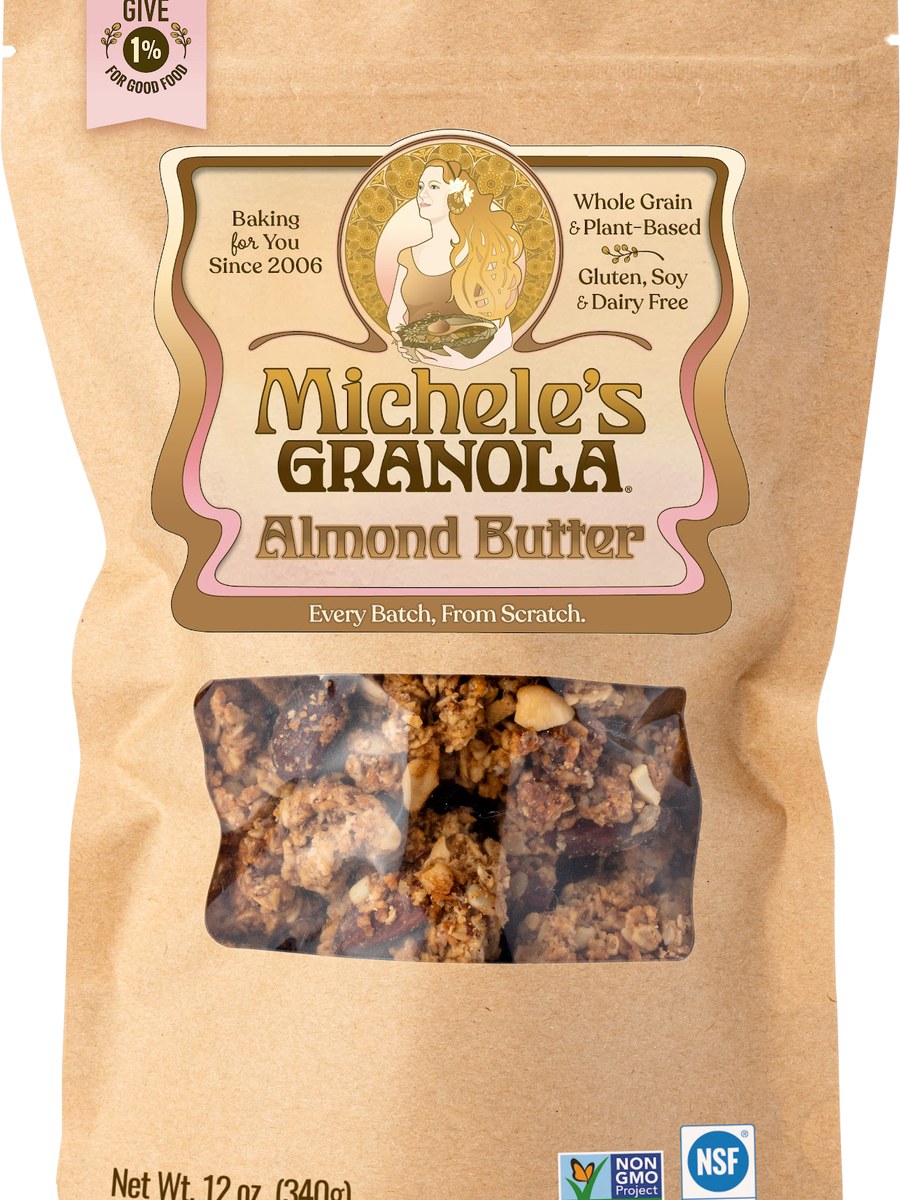 Michele's Granola Almond Butter Granola ~18% Protein (Poor) 38% Fiber (Good) 36% Sugar (Poor) 6 Tier A 5.9 / 10
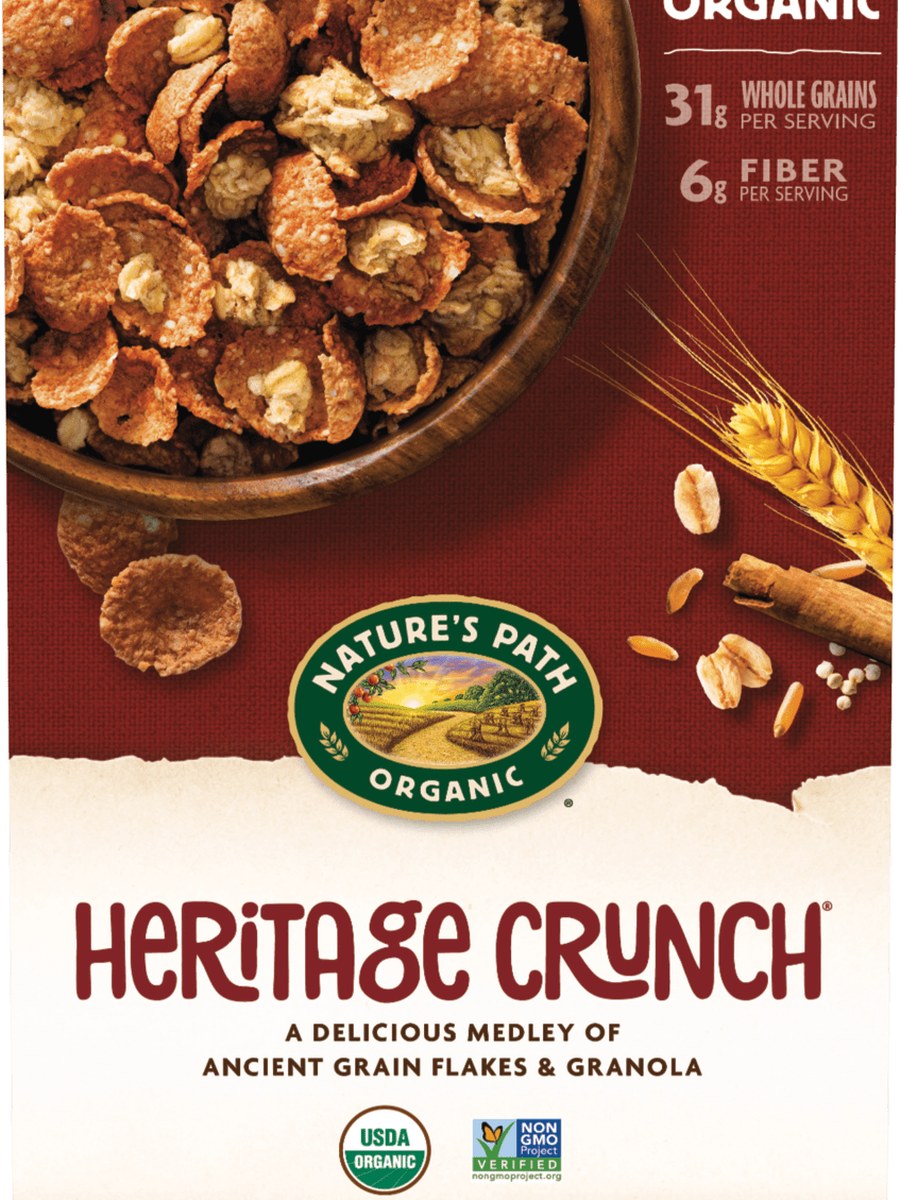 Nature's Path Heritage Crunch ~14% Protein (Poor) 39% Fiber (Good) 25% Sugar (Middling)
 Seven Sundays Bright Side Granola, Triple Berry 15% Protein (Poor) 36% Fiber (Good) 30% Sugar (Poor) 8 Tier B 5.7 / 10
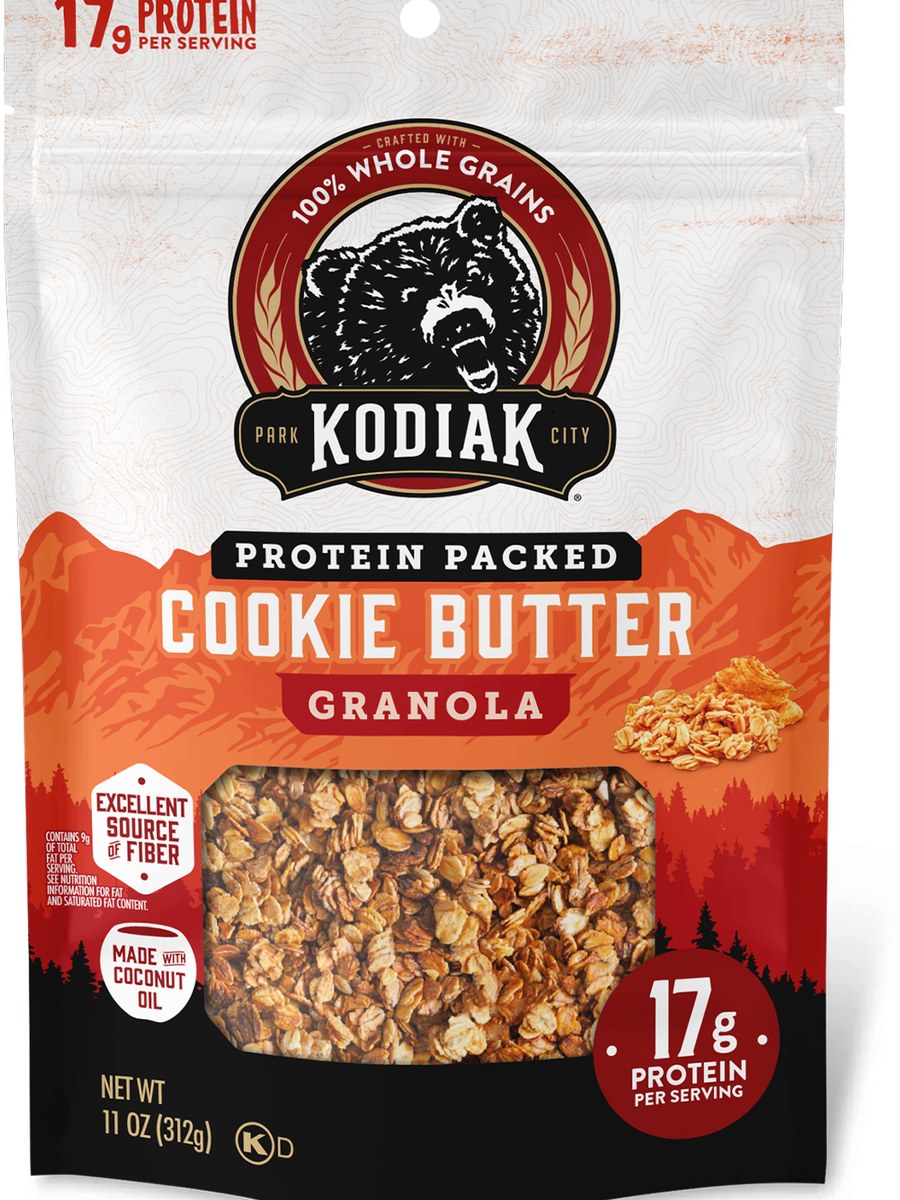 Kodiak Protein-Packed Cookie Butter Granola 31% Protein (Good) 39% Fiber (Good) 28% Sugar (Poor) 9 Tier B 5.6 / 10
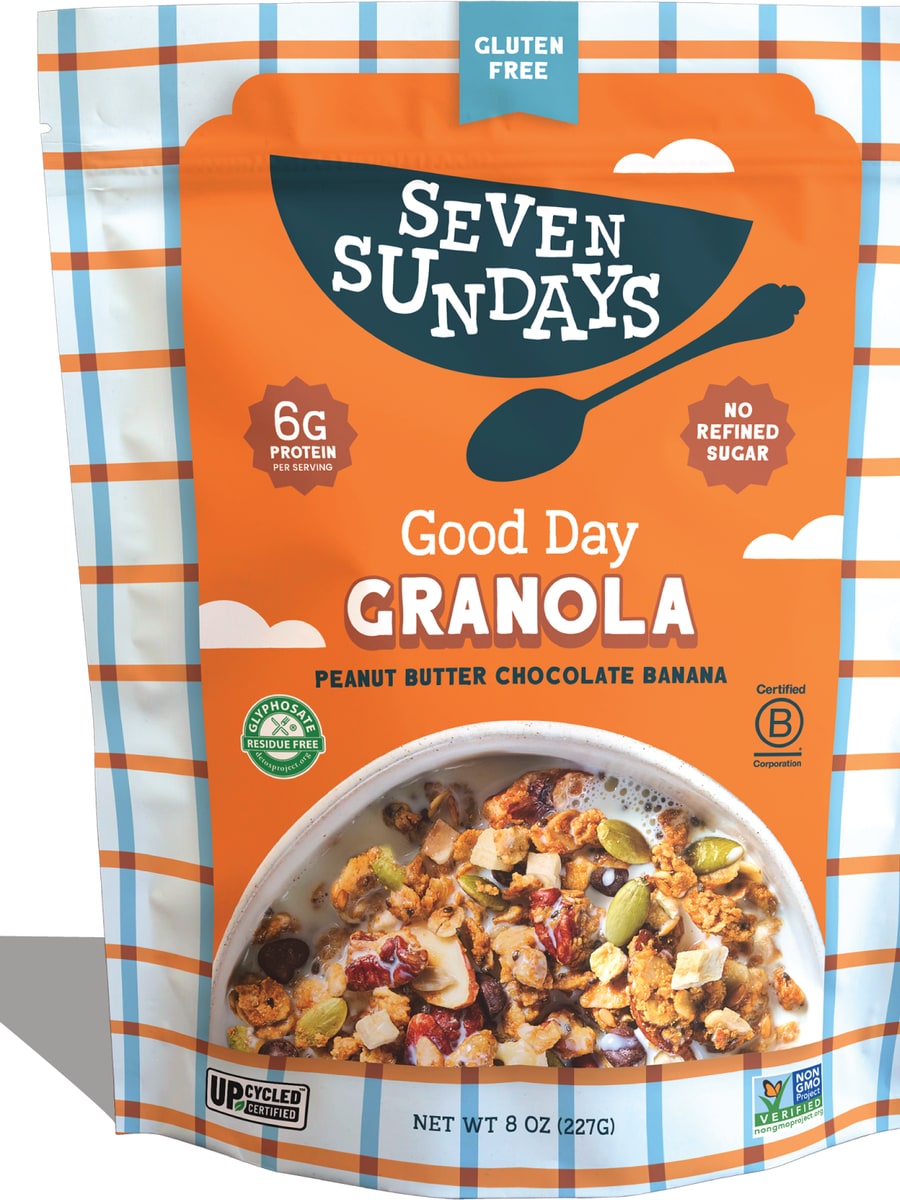 Seven Sundays Good Day Granola, Peanut Butter Chocolate Banana 13% Protein (Poor) 36% Fiber (Good) 30% Sugar (Poor)
The other aisles
The same nutrition targets as the cereals. Bars and snacks are measured per 100 grams, like the cereals, and milk per 250 mL, about what goes on a bowl. Each aisle is ranked only against itself, never against the cereals.
Bars 8 bars on file
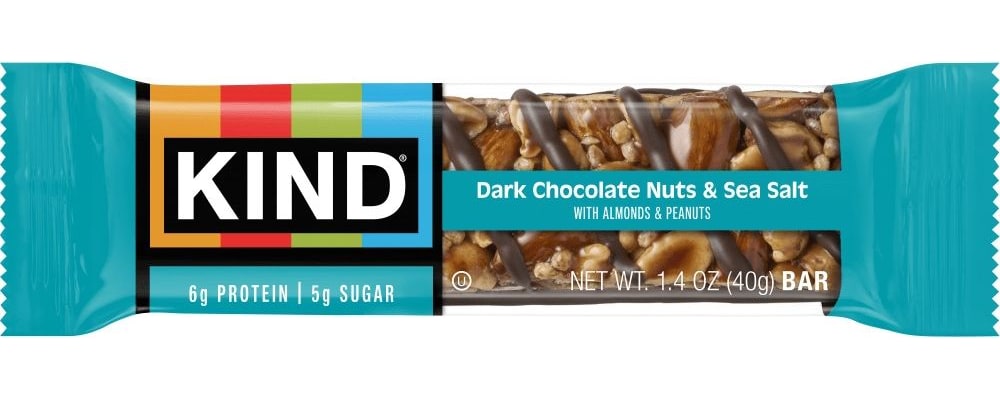 KIND Dark Chocolate Nuts & Sea Salt 13% Protein (Poor) 63% Fiber (Good) 25% Sugar (Middling) 2 Tier C 5.0 / 10
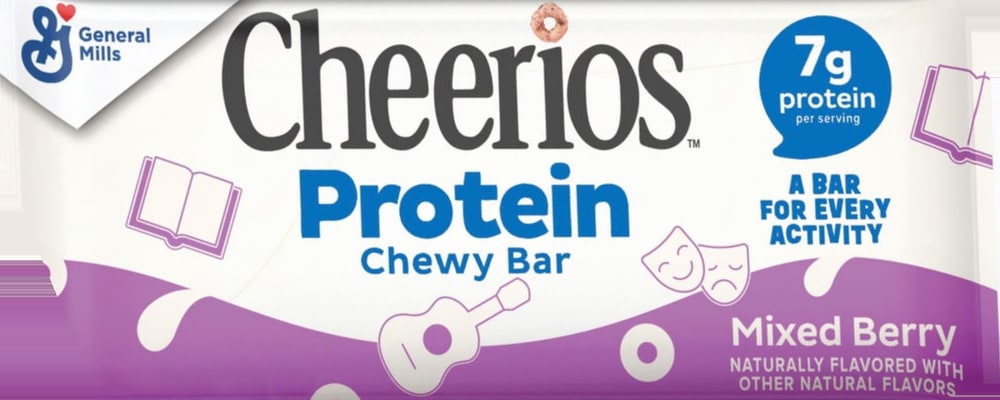 General Mills Cheerios Protein Chewy Bar, Mixed Berry 33% Protein (Good) 50% Fiber (Good) 61% Sugar (Watch out) 3 Tier D 4.8 / 10
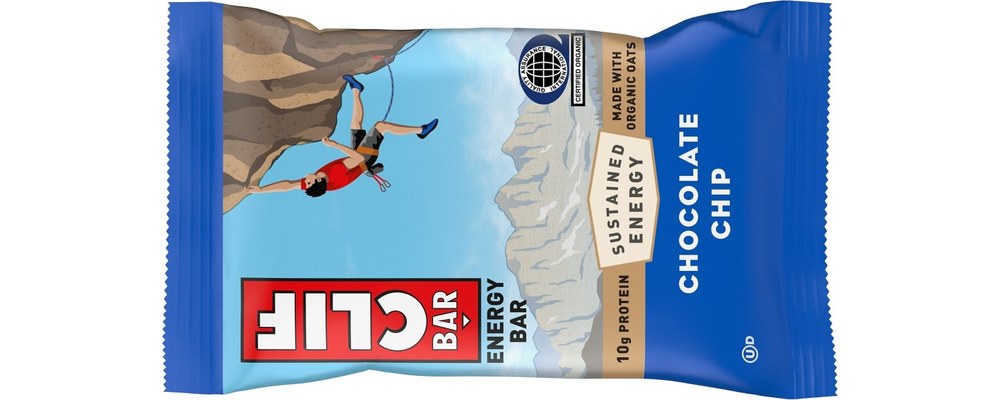 Clif Bar Chocolate Chip 28% Protein (Good) 26% Fiber (Middling) 50% Sugar (Watch out)
Milk 3 milks on file
Milk gets a Health score only: the nutrition half of the Tier score, with no Taste score and no Tier letter. It is shown and graded per 250 mL, about what goes on a bowl of cereal, where everything else is per 100 grams. Compare it with other milks, not with a dry cereal.
But wait, there’s more — and less!
More protein. More fiber. Less sugar. These are the boxes that hold the shelf records, per 100 grams, taken off the side panel. The front of the box is an advert; the side is the truth.

Browse the aisles
Every box is filed under everything it honestly is. Nothing is filed under anything it isn’t.